

With the rapid growth of UV-C LEDs in disinfection and sterilization applications, there is an increasing need to quantify and determine whether a particular UV-C lamp or device is accomplishing its disinfection goals. Unlike conventional lighting products where we can visually confirm whether it is “bright enough”, UV-C is invisible to the naked eye and this can make it particularly challenging from a measurement perspective. In this article, we will explore the basic principles and measurement methods, then go through some examples that will help walk through the necessary steps in determining the irradiance requirements for a particular setup.
Dose = UV exposure + Time
When designing UV-C disinfection, we need to start with UV-C dosage, because the ultimate goal is to achieve a certain UV-C dose required to inactivate pathogens. But first, what exactly is dosage and how is it measured?
UV-C dose, also known as exposure dose or fluence, is a measure of the total UV-C energy delivered to a particular surface. This is the most important factor in UV-C system design, because UV-C dose is the primary determinant of whether we successfully achieve pathogen inactivation.
Dosage is determined not only by the intensity of the UV-C light hitting a surface, but also by the amount of time the surface is exposed to the UV-C radiation. In other words, all else being equal, a UV-C lamp with half the intensity can deliver the same UV-C dose if it is used for twice as long.
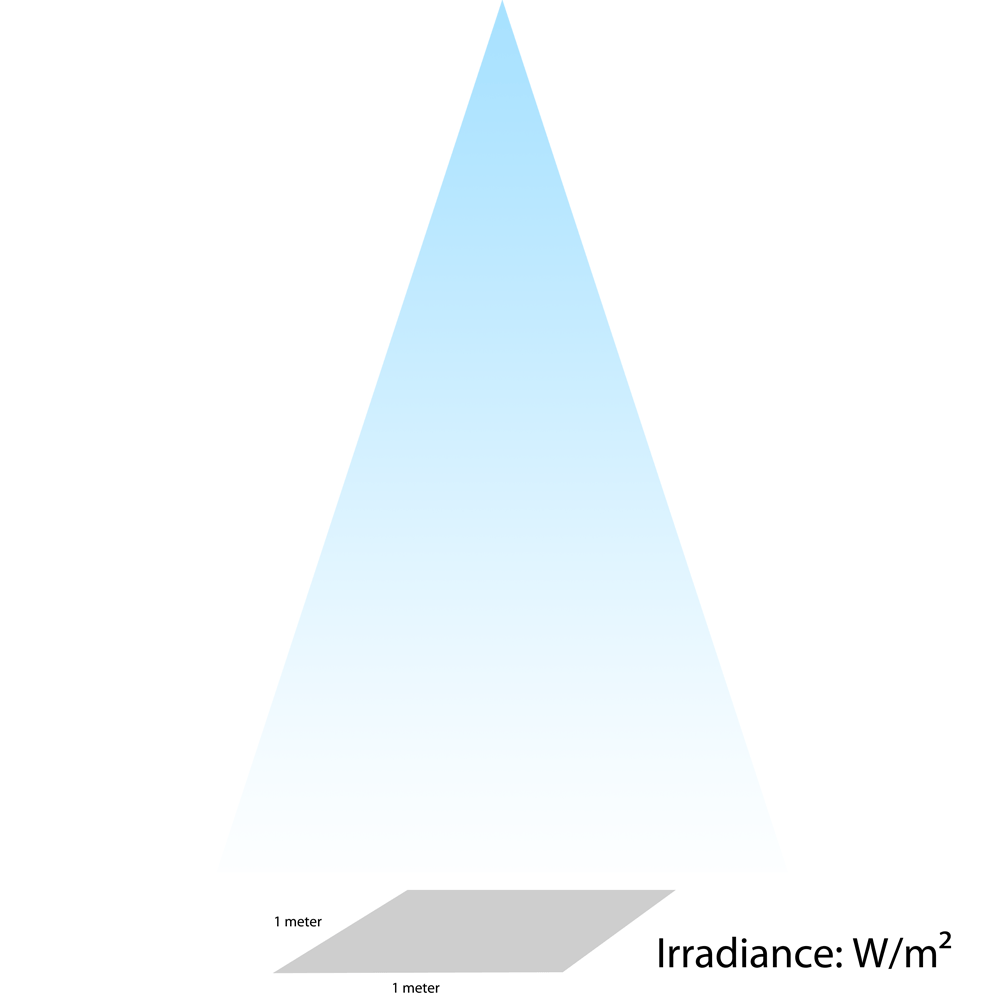
The intensity of UV-C light falling on a surface is called irradiance and is measured in W/m2 (or some variation of power per surface area). Exposure time is measured in seconds.
The simple form of the formula is shown below:
Exposure dose (J/m2) = UV radiation (W/m2) x Time (seconds)
We can also verify this by seeing that the units here match (1 Joule = 1 Watt -second).
What exactly is UV-C radiation?
The most difficult and perhaps most important part of this equation is the emissivity. Emissivity is a measure of the amount of energy falling on a given surface. Emissivity can be affected by three main factors: (1) the intensity of the UV lamp, (2) the distance from the lamp, and (3) the angle to the lamp. It can be helpful to think about the operation of a conventional light bulb—for example, a very bright bulb placed far away and angled to the surface will not provide adequate illumination on a tabletop.

Caution: Don’t confuse radiant watts with electrical watts! While it may be tempting, relying solely on the electrical rating of a UV lamp is not sufficient for two reasons. First, the electrical rating of a lamp refers to the amount of electrical energy it consumes. This is different from the amount of UV energy it produces (“radiance”). For example, a 20-watt UV lamp may only produce 2 watts of actual UV-C energy (i.e., it has an efficiency rating of 10%). Second, even if we know how many watts of radiation a UV lamp produces, we don’t know how and where the UV energy is distributed. The actual irradiance is a measure of the UV-C at a specific location and distance from the UV lamp.
How to interpret the manufacturer’s UV-C irradiance chart
If you consider what UV-C radiation values represent, you can appreciate how difficult it is to compare UV-C products between different manufacturers. The best way to make an accurate comparison is to look at the radiation charts of UV-C products to determine what level of UV-C radiation you can expect. If a manufacturer does not publish a radiation chart or does not know what you are asking for, it is likely that the manufacturer does not understand the product or the principles behind UV-C disinfection.
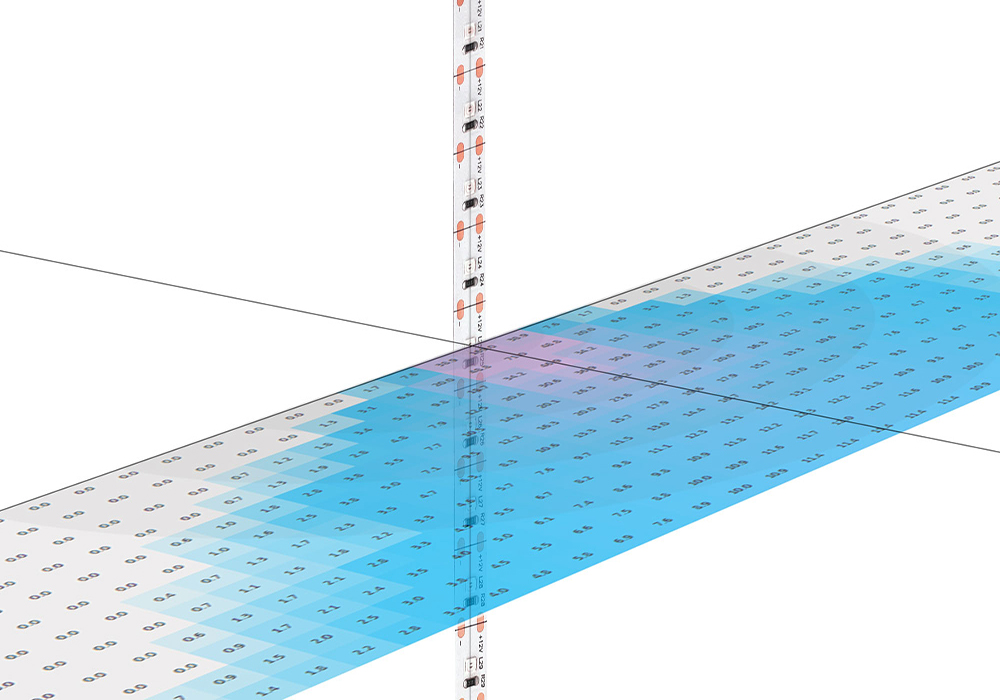
Below is a screenshot from the published irradiance chart for our cleanUV™ LED strip, annotated in red. The values in each square represent the irradiance values, in W/m2, that can be expected at that particular location, relative to the UV-C source. This is a virtual representation of the chart’s orientation relative to the UV-C LED strip.
For example, we can use this graph to see that the irradiance value at approximately 6″ away and a 45 degree angle would be 0.13 W/m2 and a point 12″ away but directly perpendicular to the UV-C LED strip would have an irradiance value of 0.19 W/m2.
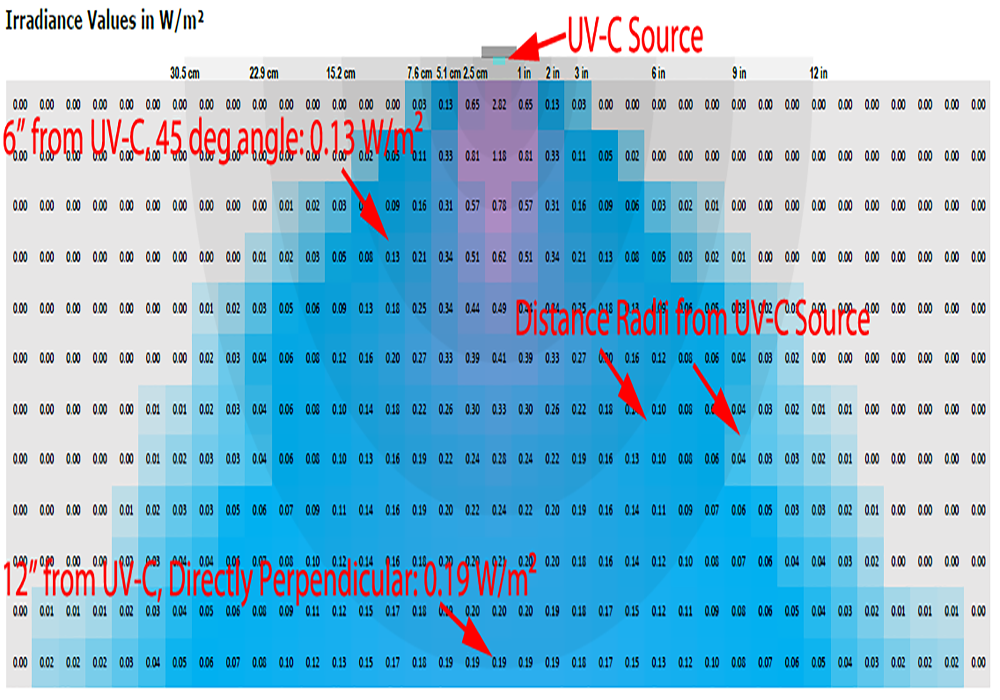
Intuitively, you will see that the higher the irradiance values, the closer they are to the UV-C source and the closer they are to the perpendicular axis. Additionally, using an irradiance chart, you can more effectively estimate the amount of UV radiation you can expect from a UV-C source at a given distance and angle. There are no hard and fast rules or formulas for calculating these values, so an irradiance chart is usually your best bet.
Example 1: Achieving a dose of 50 J/m2
Suppose you are tasked with designing a UV-C system with a target dose of 50 J/m2. How would we do it?
Luckily, you are not given any further constraints so you can achieve this in a variety of ways.
First, we take the formula below:
Exposure Dose (J/m2) = UV Radiation (W/m2) x Time (seconds) and see that as long as UV radiation multiplied by time gives us 50 J/m2, we will meet the requirement here. For example, 50 W/m2 for 1 second, 25 W/m2 for 2 seconds or 1 W/m2 for 50 seconds all produce 50 J/m2 and are acceptable for achieving the required dose.
Example 2: Achieving a Dose of 50 J/m2 within 25 seconds
In this example, we are given the same dosage goal but with a time constraint.
Substitute the values into the same formula and solve for the UV radiation:
50 J/m² = UV radiation x 25 seconds gives us 2 W/m².
Using the irradiance chart, we can look for locations that deliver 2 W/m2 or more and be confident that these areas will receive enough UV-C radiation to reach the target dose of 50 J/m2 within the 25-second time limit.
Example 3: Determine the dose range of the cleanUV™ LED strip on a 9 square inch surface from a distance of 6 inches after 1 minute
Our final example may seem the most difficult due to the many conditions we are dealing with. However, after breaking it down, we will see that it is actually quite simple if we look up the exposure dose graph, which is similar in concept to the radiation graph shown above, but is displayed using exposure dose values based on certain time frames.
The example question asks for the dose after 1 minute of exposure, so we first show a chart showing the dose after 1 minute of exposure (page 2 of the PDF). Next, since we are looking at a cross-section of the LED strip, the 9 square inch area will also be represented as a cross-section and thus represented as 3 inches wide. Since each square represents an inch, we look for three squares representing one side of the 9 square inch area located 6 inches from the UV-C source.
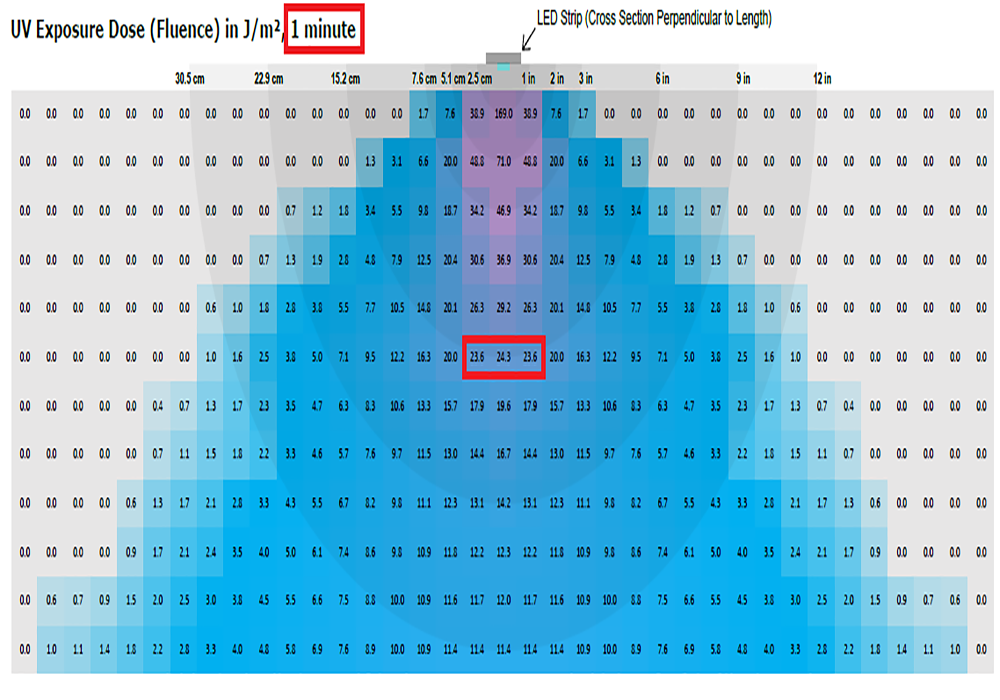
We see that the numbers are 23.6, 24.3, and 23.6, which means that our exposure dose range on this surface area will be between 23.6 J/m2 and 24.3 J/m2.
See more: Use UV Dose To Help Find The Right UV System
To learn more about other powerful and unique water filtration systems distributed by Song Phung, order online at the website https://thietbinganhnuoc.com/san-pham or contact us on our hotline 0913.90.72.74 – 0984.620.494 for further inquiring.
Follow Fanpage: https://www.facebook.com/SongPhungthietbinganhnuoc/ to be updated with new products.